Fluorescence Correlation Spectroscopy
Fluorescence Correlation Spectroscopy (FCS) and the related Fluorescence Cross Correlation Spectroscopy (FCCS) are techniques for the study of molecular movements and interactions. In addition, the concentration of the fluorescent molecules can be measured. FCS can be performed either in solutions or in the living cell.
FCS can be done at the CCI either with the GaAsP detector on the LSM 780 or the LSM880 system. Both of these systems can work in regular autocorrelation mode as well as dual color cross-correlation mode.
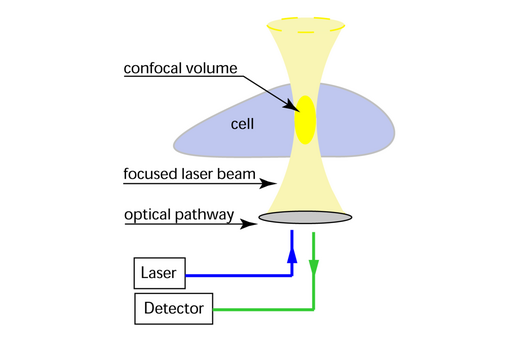
In FCS a laser beam is focused and parked somewhere in the specimen, see Fig. 1, and the fluctuations in the fluorescence signal is monitored as a function of time.

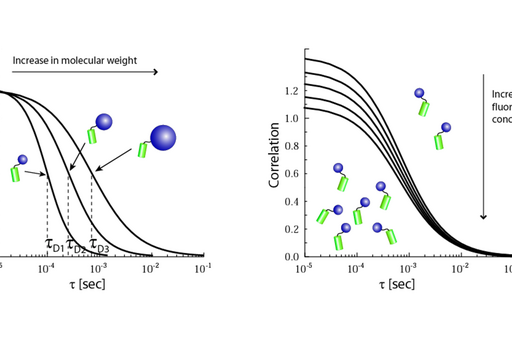
These fluctuations, which are considered noice in confocal laser scanning images, depend on the number of fluorophores in the small confocal detection volume and how fast they move in and out of the volume, see Fig. 2.

Therefore the fluorescence fluctuations provide information about concentrations and diffusion parameters of a fluorescent particle. Since the diffusion is directly dependent on the particle's mass any increase in the mass of a biomolecule, e.g. as a result of an interaction with a second molecule, is readily detected as an increase in the particle's diffusion time.
The time-dependent fluorescence intensity (F(t)) is analysed by calculating its autocorrelation function (G(t)), which compares the fluorescence intensity at time t with the intensity at (t + t), where t is a variable interval, averaged over all data points in the time series (denoted by < >), see Fig. 3.

The fluorophore concentration is found from the amplitude of the autocorrelation curve and diffusion time of the molecules is the halftime of the decay of the autocorrelation curve. Examples of how this autocorrelation function changes with different concentrations and different mass is pictured in Fig.4.

Fluorescence Cross Correlation Spectroscopy (FCCS) uses the cross-correlation function, which compares the fluorescence intensity of one fluorescently labelled species at time t with the intensity of an other species, labelled with a different fluorophore, at (t + t). From this analysis the fraction of interacting particles can be obtained, without reference to their diffusion characteristics. In practice, discrimination on the basis of mass in conventional FCS requires that the interacting components should have a molecular weight ratio of at least 1:8.
